qualitative research, interview studies, synthesis, recommendations, wireframesChallenge: The goal was to redesign the interface to empower users with comprehensive trailer knowledge while minimizing operational overhead.
Landstar's trailer pool management system suffered from fragmented processes and inconsistent communication channels. Agents struggled with time-consuming manual reconciliation, lacked visibility into trailer status, and faced cognitive overload from disparate systems.
Process
✦
research
✦
competitive audit
✦
wireframes
✦
prototype
✦
review
✦
implement
✦
measure
✦ research ✦ competitive audit ✦ wireframes ✦ prototype ✦ review ✦ implement ✦ measure
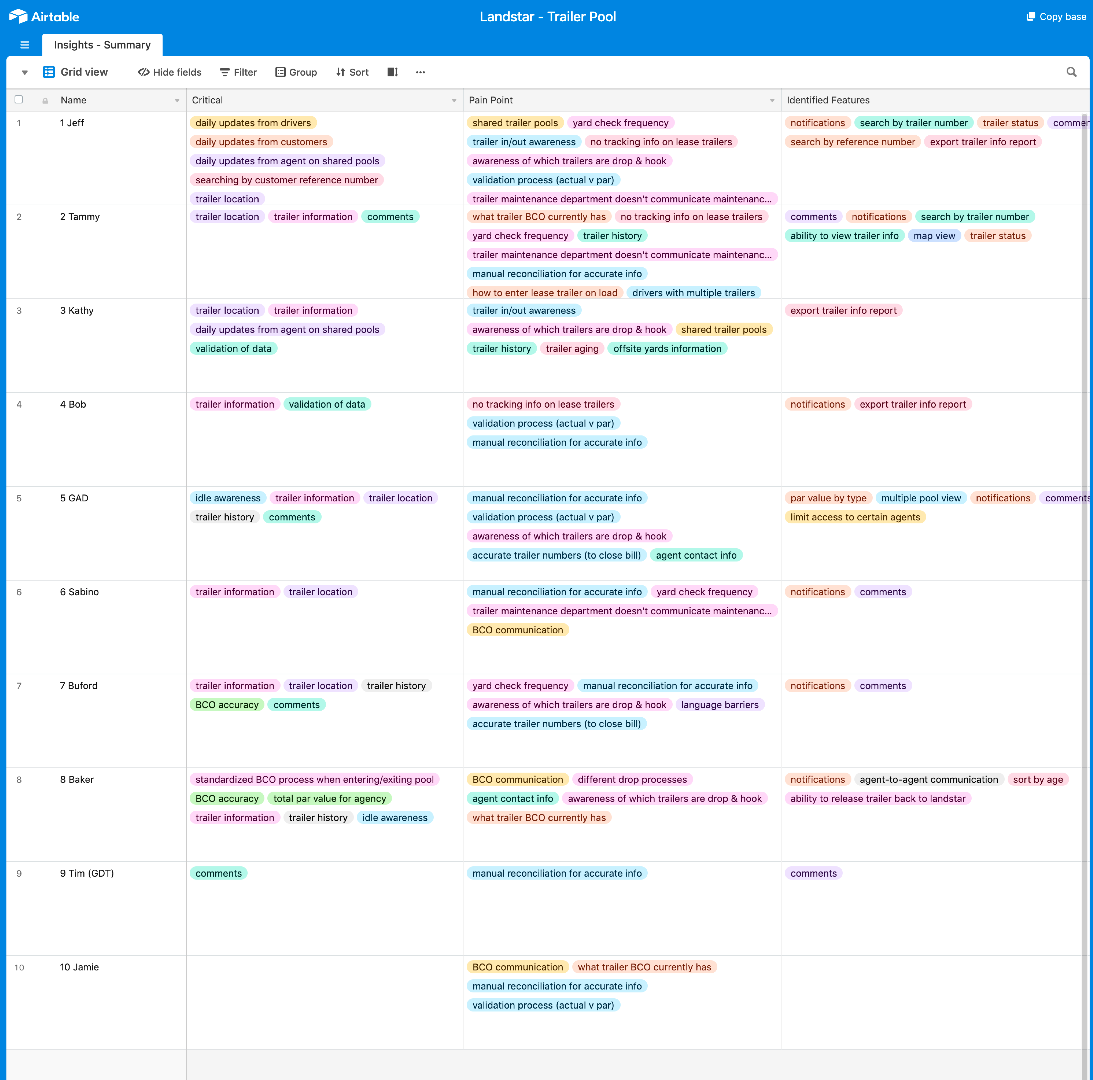
User Research Methodology
The team conducted comprehensive user interviews with 10 stakeholders to identify critical pain points and workflows. Research data was visualized in Airtable, revealing patterns that informed design priorities.
Key Findings
Top 4 User-Identified Features:
Notifications (7 users)
Comments (6 users)
Export trailer info report (3 users)
Search by trailer number (2 users)
Top 4 Critical Workflows:
Trailer information (7 users)
Trailer location (6 users)
Comments (4 users)
Trailer history (3 users)
Top 4 Pain Points:
Manual reconciliation is time-consuming (7 users)
Poor awareness of drop-and-hook trailers (5 users)
Fragmented validation processes (4 users)
Inconsistent yard check reporting (4 users)
The design approach centered on addressing cognitive overload—recognizing that when working memory receives more information than it can handle, users experience frustration and make more errors.
Core Problems
Inconsistent systems and processes for trailer pool management
Different customers requiring different reports and information
Communication bottlenecks, especially in agent-to-agent communication and trailer maintenance departments
Design Strategy
Empower end users with complete trailer knowledge
Make changes and required actions immediately visible
Create shared processes to minimize overhead
Mitigate cognitive overload and reduce reliance on working memory
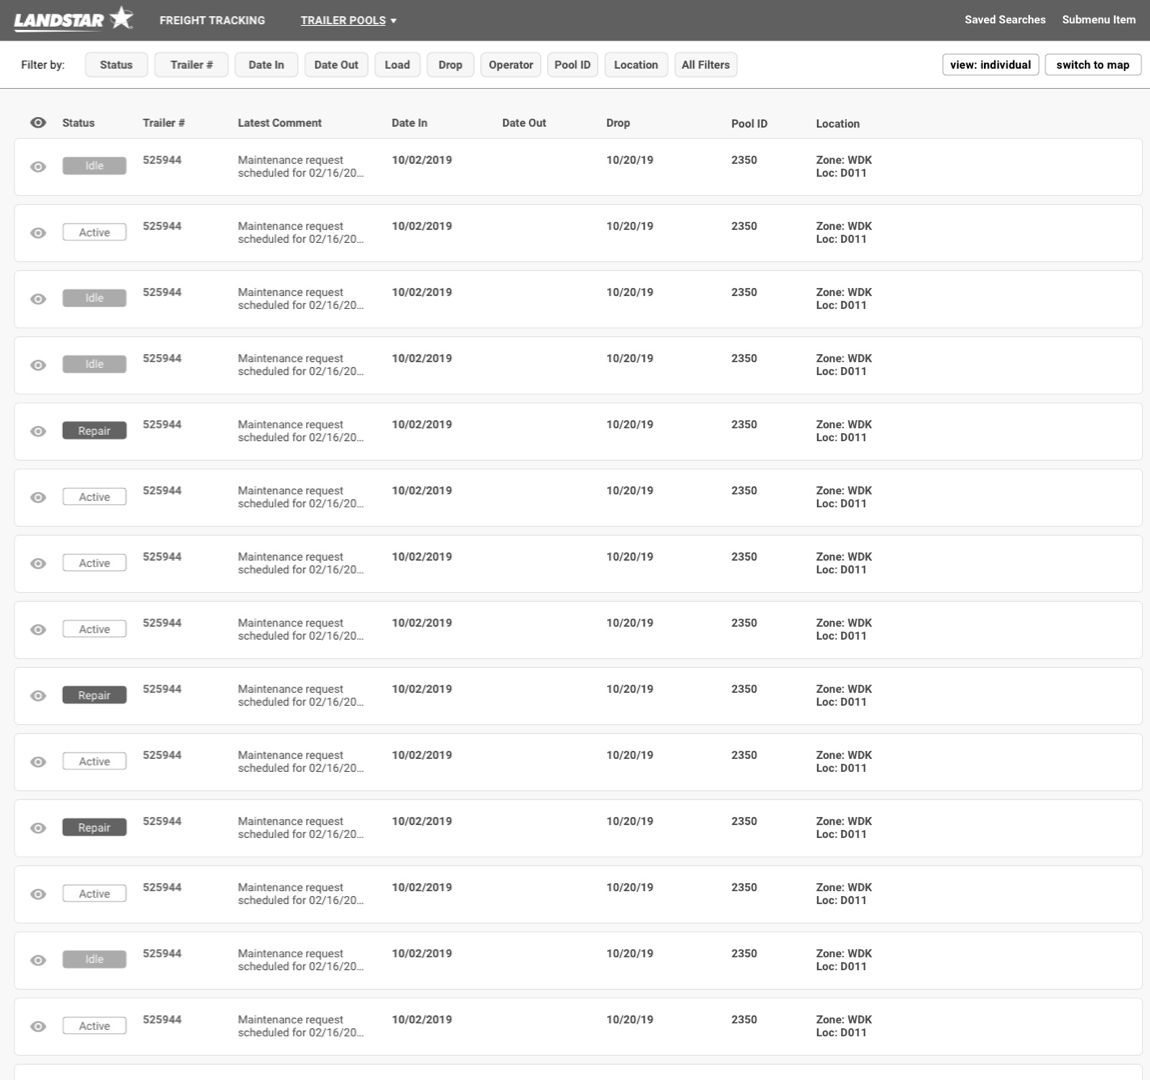
Default List View
Each trailer displayed as an individual record
Quick-access trailer preview
Filterable by relevant columns and data types
Ability to switch between Map and Grouped views
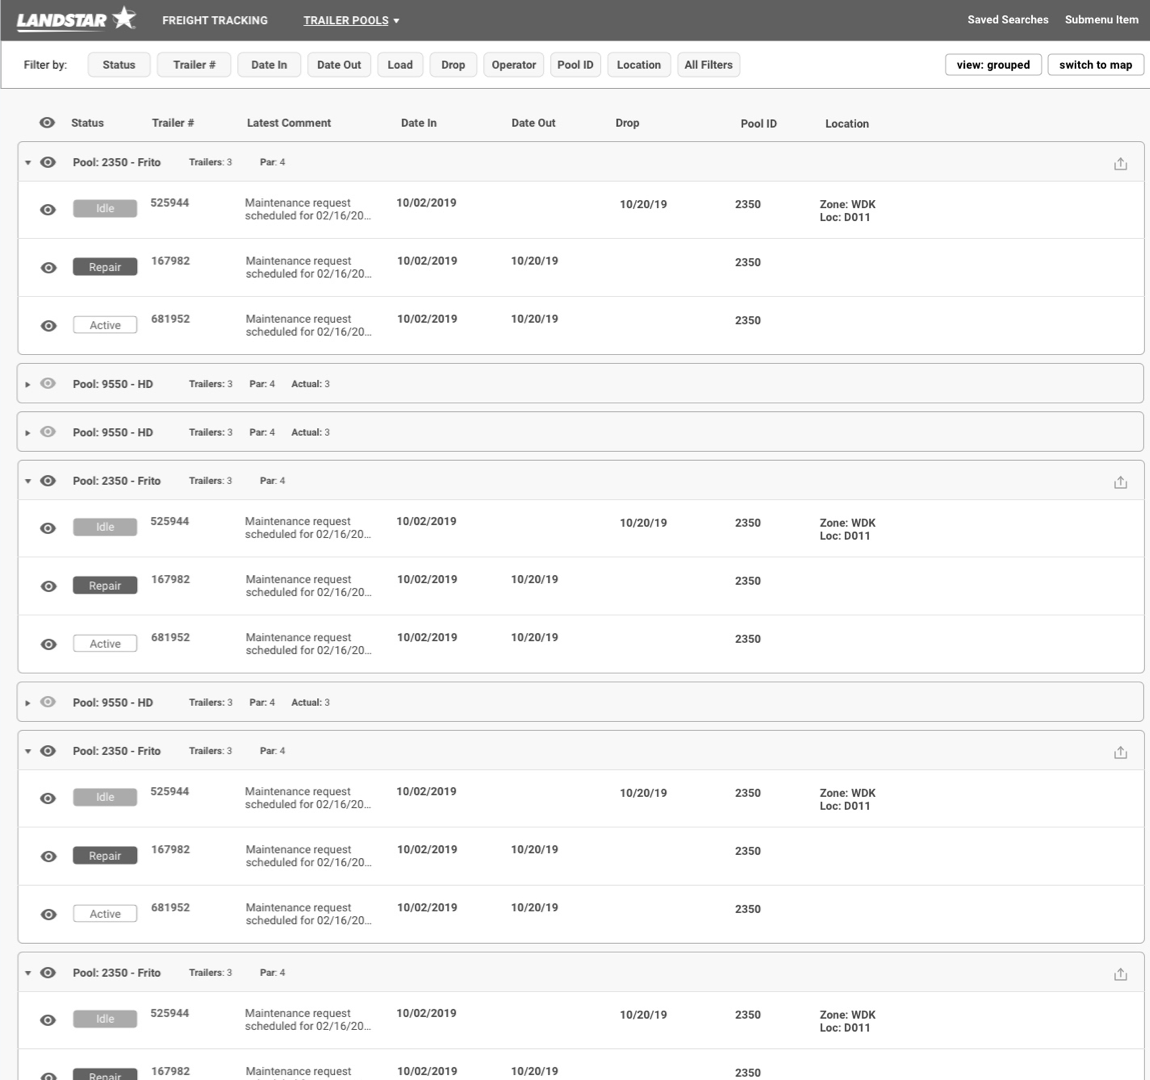
Grouped View
Pool-based organization instead of trailer-only view
Logical grouping for quick tracking of relevant trailers
Pool Quickview for detailed history investigation
Maintained filtering capabilities
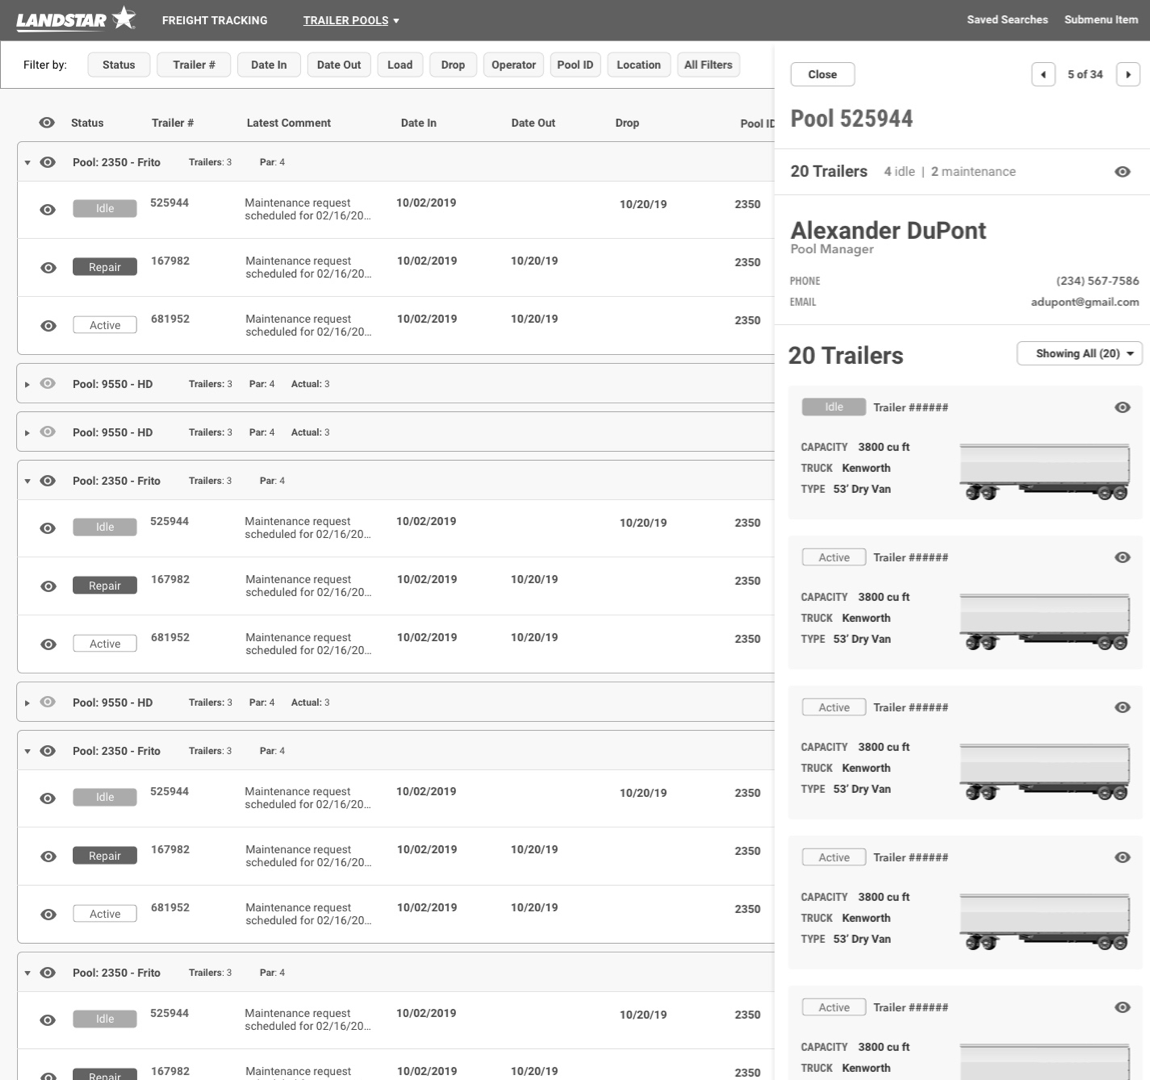
Pool Quickview
Detailed information without page load latency
Access to trailer details and history
Quick filter for idle trailers
Main contact information for pools
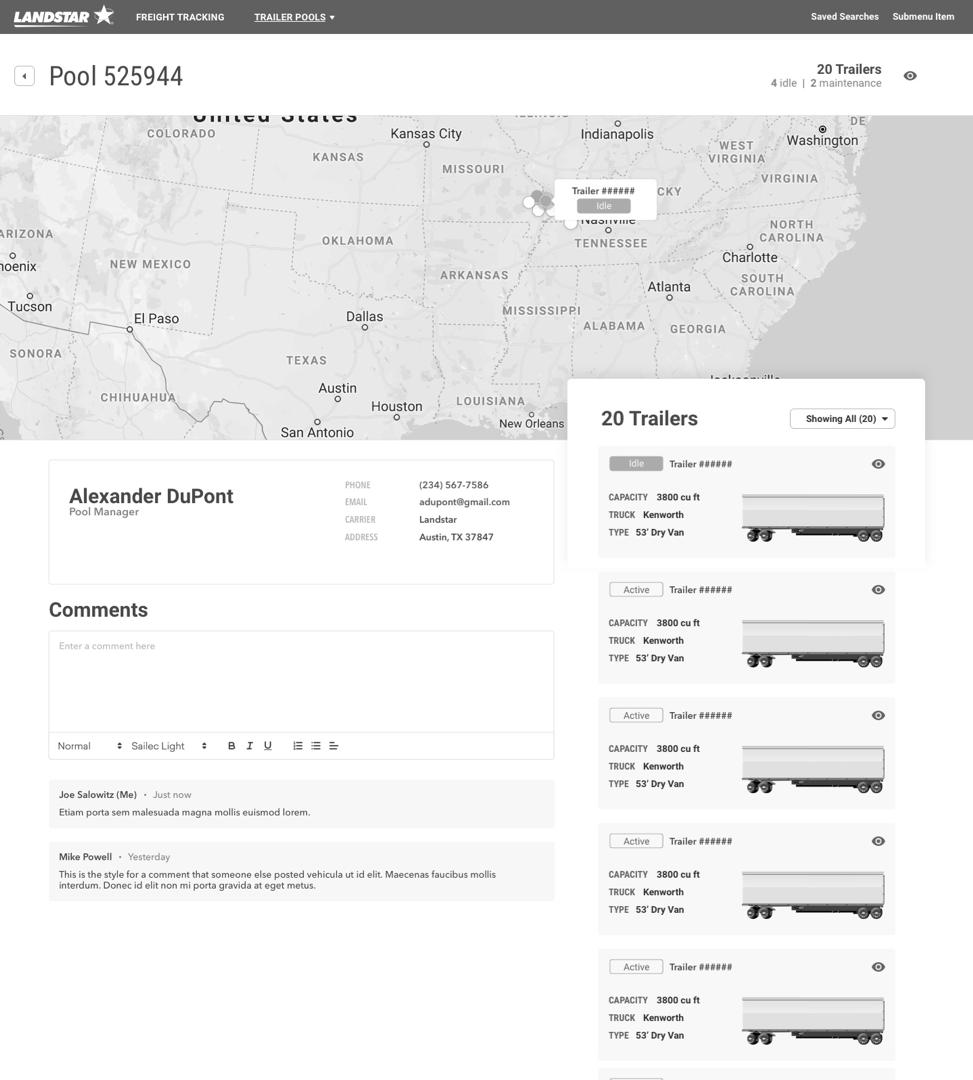
Pool Detail View
Comprehensive trailer details and history
Filter for idle trailers
Main contact information
Comments logging for complete pool history
Map visualization of pool locations
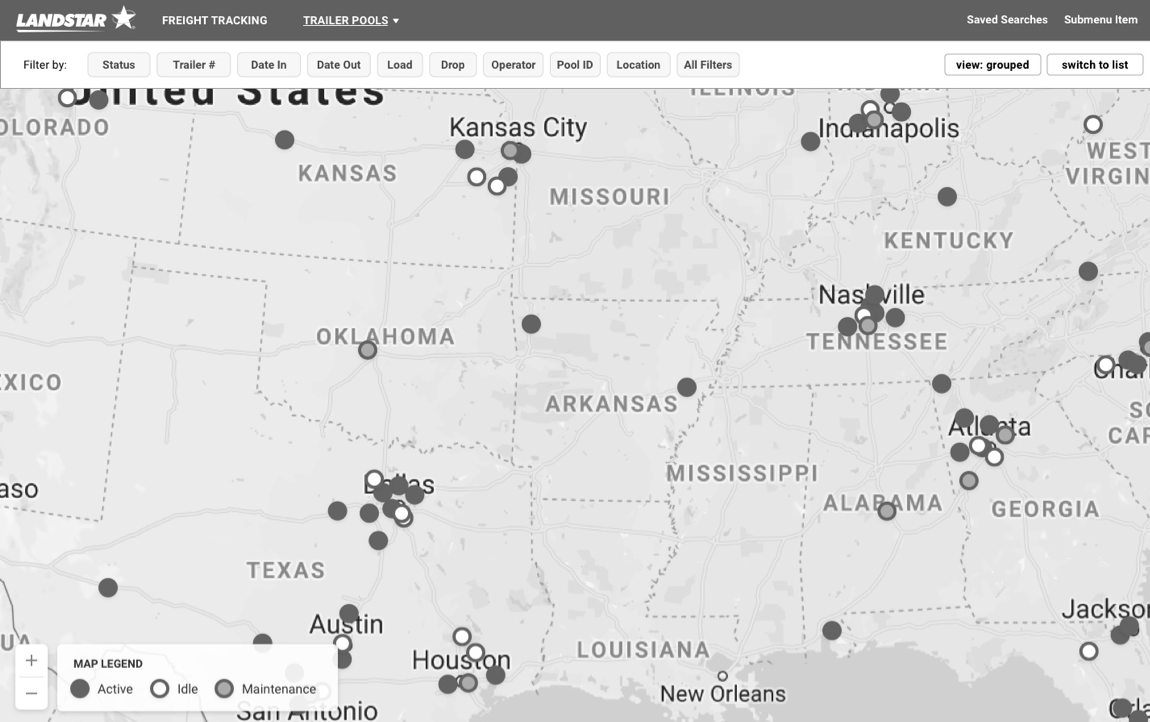
Map View
Geographic snapshot of pools and trailer locations
Interactive dots revealing trailer status
Clear legend minimizing icon dependency for accessibility
Full filtering capabilities
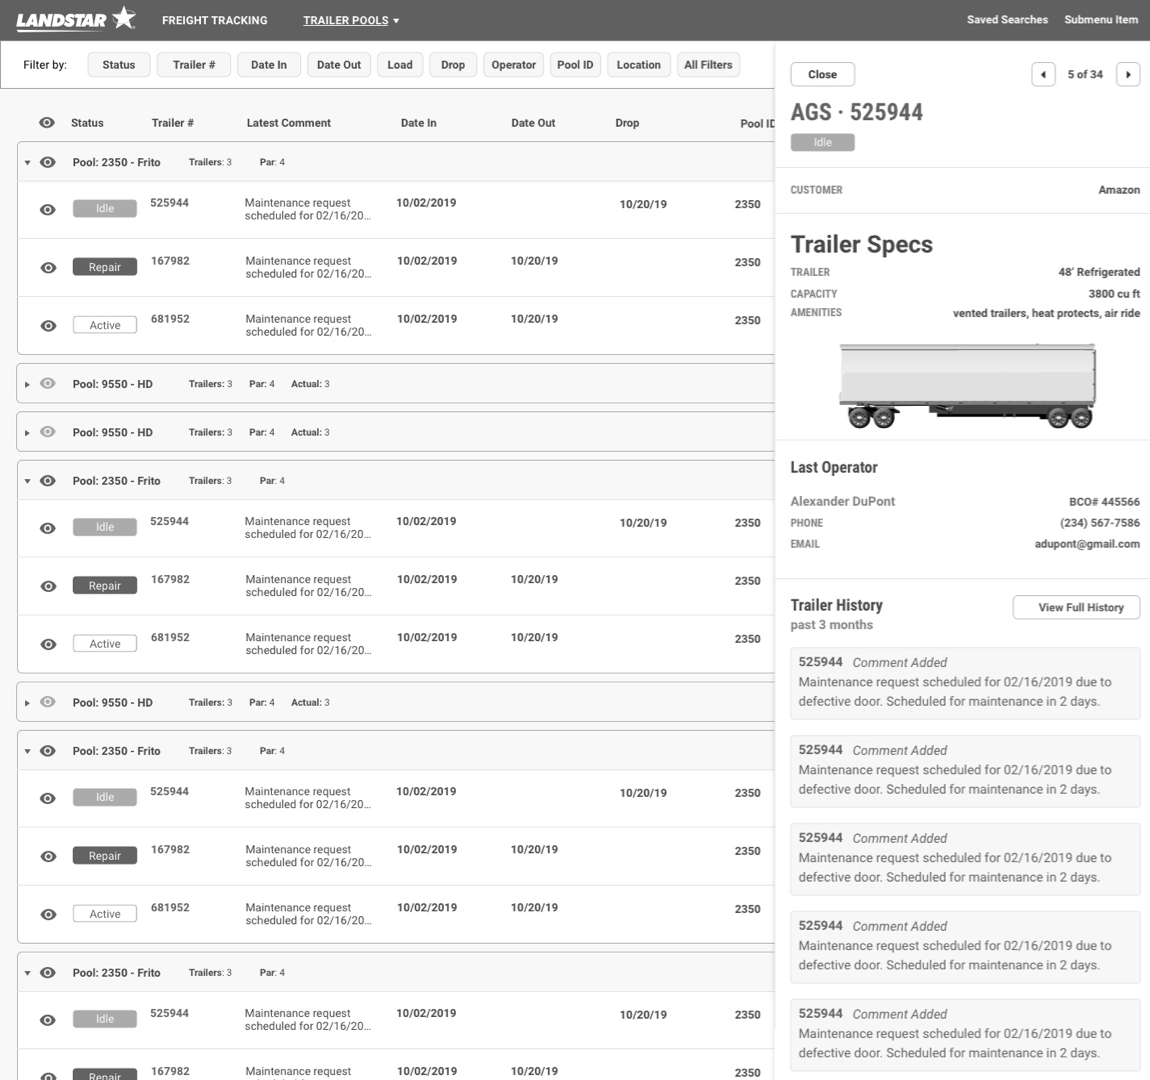
Trailer Quickview
Reduced performance lag with in-context information display
Recent history visibility
Quick access to full detail views
Seamless navigation within workflows

Future Vision
The long-term roadmap included:
Dashboard approach for pool status overview
Real-time trailer-level comments feed
Seamless backend integration with other agents, BCOs, and Landstar systems
Automated data inputs to reduce manual reconciliation
Key Design Decisions
Visualization-First Approach: A multi-view strategy. Rather than forcing users into a single interface, the design empowered them to choose the most effective lens for their current task.
Cognitive Load Reduction: By providing multiple specialized views rather than one complex interface, the design allowed users to focus on relevant information without unnecessary distraction. The quick-view patterns eliminated page load delays while preventing information overload.
Communication as Infrastructure: Comments and notifications were elevated from peripheral features to core workflow components, addressing the identified communication bottlenecks.
Lessons Learned
User-Centered Discovery is Essential: The comprehensive user research with 10 stakeholders revealed patterns that wouldn't have been apparent through assumptions alone. Visualizing research in Airtable helped identify consensus around priorities.
Cognitive Science Informs Better Design: Understanding cognitive overload and working memory constraints provided a theoretical foundation for practical design decisions, justifying choices like quick-views over full page loads.
Flexibility Over Rigid Structure: Rather than forcing users into a single "best" interface, providing multiple purpose-built views respected different mental models and workflow preferences.
Communication is a Feature: Elevating comments and notifications from nice-to-haves to core features acknowledged that logistics operations depend on coordination as much as information access.
Quotes
Regional Agent, 14 years experience (collected in December 2019 user interview)
“This is night and day from what we had before. I can actually see what's happening with my pools without calling ten different people.”
Senior Pool Manager (collected in January 2020 user survey)
“The group view saved my life during peak season. I could manage 30% more pools without working overtime.”
Operations Coordinator (collected in November 2019 feedback session)
“Finally, a system that thinks like I think. The map view alone cut my morning review time in half."
Efficiency Gains
63% reduction in time spent on manual reconciliation
Measurement: Time-tracking study comparing average daily reconciliation tasks. Pre-launch average: ~87 minutes/day. Post-launch (3-month): 32 minutes/day.
Metric captured through: Self-reported time logs (validated against task completion timestamps in system logs)41% decrease in average task completion time
Measurement: Common workflows (locating trailer, updating status, generating reports) tracked via application event logging. Pre-launch average: 3.2 minutes. Post-launch: 1.9 minutes.
Metric captured through: Automated timestamp tracking between task initiation and completion78% faster trailer location lookup
Measurement: Time from search initiation to information viewed. Pre-launch average: 54 seconds. Post-launch: 12 seconds.
Metric captured through: Analytics event tracking with millisecond precision
Measuring impact
Following the phased rollout in August 2019, we tracked key performance indicators over a 3-month period (September 2019 - February 2020) using a combination of analytics instrumentation, time-on-task studies, and user surveys.
Measurement Approach:
Quantitative Metrics: Google Analytics event tracking, application logs, and database queries measuring feature usage, task completion times, and error rates
Qualitative Feedback: Monthly user satisfaction surveys (System Usability Scale), in-depth interviews with 10 power users
Baseline Comparison: Pre-launch metrics collected during July-August 2019 using the legacy system
Sample Size: 47 active agents across 8 regional offices using the system daily
Key Performance Indicators
User Adoption & Engagement
89% of users regularly utilize multiple view options
Measurement: Percentage of users switching between List, Grouped, and Map views within a single session, measured weekly.
Metric captured through: View-change event logging in Google Analytics4.7x increase in comments usage
Measurement: Average comments per trailer per month. Pre-launch: 2.3 comments. Post-launch: 10.8 comments.
Metric captured through: Database queries counting comment entries by date rangeDaily active usage increased from 68% to 94%
Measurement: Percentage of licensed users logging in daily. Pre-launch: 32 of 47 users. Post-launch: 44 of 47 users.
Metric captured through: Authentication logs and session data
Error Reduction & Quality
52% reduction in data entry errors
Measurement: Errors requiring correction within 24 hours of entry. Pre-launch: 127 errors/month. Post-launch: 61 errors/month.
Metric captured through: Audit logs tracking record modifications and correction flags23% decrease in "trailer not found" incidents
Measurement: Support tickets reporting inability to locate trailers that existed in system. Metric captured through: Help desk ticketing system categorization51% reduction in yard check reporting discrepancies
Measurement: Mismatches between physical yard checks and system records. Pre-launch: 43 discrepancies/month. Post-launch: 21 discrepancies/month.
Metric captured through: Variance reports comparing yard check submissions to system data
Business Impact
Estimated $127,000 annual time savings
Calculation: 55 minutes saved per user per day × 47 users × 240 working days × $21/hour average loaded labor cost = $127,440/year
Measurement period: Projected annual savings based on 3-month validated time savings data23% improvement in trailer utilization rate
Measurement: Percentage of trailers actively generating revenue vs. idle. Pre-launch: 71% utilization. Post-launch: 87% utilization.
Metric captured through: Business intelligence dashboard tracking trailer status and revenue generation37% reduction in "lost" trailer incidents
Measurement: Trailers requiring physical location efforts because system location was unknown or inaccurate. Pre-launch: 19 incidents/month. Post-launch: 12 incidents/month.
Metric captured through: Operations reports and incident logs